|
Title Analyzing Recycling Opportunities in South Lake Tahoe |
|
|
Author Jennie Catalano American River College, Geography 350: Data Acquisition in GIS; Spring 2008 Contact Information (916/327-2901, jcatalan@consrv.ca.gov) |
|
|
Abstract This study evaluates factors that influence the use of existing recycling centers and/or “drop-offs” in South Lake Tahoe. Convenience is the key to increasing recycling in this community. Factors supporting the need for convenience in South Lake Tahoe are: Weather, no existing residential curbside recycling program, tourism, and contamination of recyclable materials. The convenient locations identified for implementing some sort of recycling program are schools, businesses, supermarket parking lots, parks and other recreational areas. With recycling programs implemented in these areas, there will be an increase in awareness and a decrease of the waste of natural resources, energy and money. |
|
|
Introduction The California Department of Conservation (DOC) has developed a Comprehensive Recycling Community (CRC) Program to help communities increase beverage container recycling by assisting them with the implementation of coordinated, sustainable programs that will maximize local recycling potentials. Beginning January 2008 and
going until January 2009, South Lake Tahoe along with three other communities
(Riverside, Culver City, and Tracy) have been selected as the chosen cities.
CRC’s focus is to assist these communities in achieving an increase in
beverage container recycling by 15%. Being on the CRC team, and one of the leads for the South Lake Tahoe initiative, I will demonstrate the value of using GIS to assist in the analysis of the city’s current and future opportunities to increase recycling. Surveys of local recyclers will be conducted and used in conjunction with maps created in ArcGIS. Both will used to assist us in our discussions during the identification (ID) phase. The identification phase presents possible areas to expand or implement recycling programs and educational awareness. The maps and surveys will also be used to assist in communication during discussions with the city’s recycling coordinator, chamber of commerce, local waste hauler and many environmental groups in South Lake Tahoe. |
|
|
Background The Department of Conservation, Division of Recycling administers the California Beverage Container Recycling and Litter Reduction Act (Act) enacted in 1986. The primary goal of the Act is to achieve and maintain high recycling rates for each beverage container type included in the program. The Division provides a number of services to achieve these goals, including enforcement, auditing, grant funding, technical assistance and education. Beverage containers that get thrown away and/or get contaminated are a waste of natural resources, a waste of energy and a waste of money. An aluminum can, for example, can sit in a landfill taking decades to decompose, or it can be recycled and be back on the shelf in about 90 days, thereby: · Reducing the need for virgin bauxite ore · Saving enough energy to run a television for almost three hours · Putting cash in the pocket of the person who took it to the recycling center 80-100 YEARS - That's the lifespan of an aluminum can that gets tossed into
a landfill instead of a recycling bin. In January of 2007, a pilot project in Montery, CA was established. The project strategies were to saturate the city with staff, education , media and guidance in relation to recycling for one year. The measured success was done by first getting a baseline of what the beginning recycling volumes were and measuring the outcome after the one year period to get the percent increase or decrease. Baselines and outcomes are generated by processors who track where the loads of recyclables come from and the volume of each type of material in each load. Other measurements of success were based on surveys from before and after of the city’s knowledge of Recycling. Due to the successes with
the Monterey pilot project, the Department Director decided to implement The
Comprehensive Recycling Community (CRC) program within the Divisions
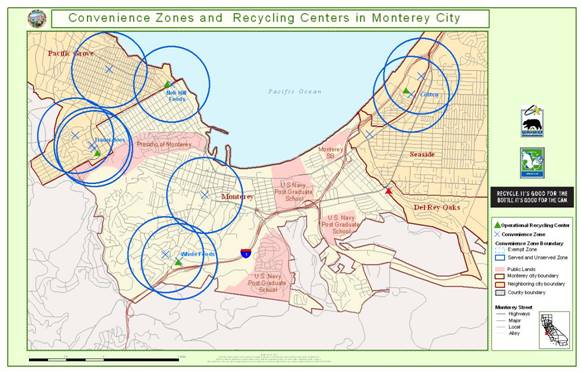
Statewide Technical Assistance and Resources Branch. The Implementation Plan included the need for research and analysis of each city’s recycling information, diversion rates, beverage container disposal volume, demographics, certified programs, educational awareness, business facilities, events, non-profit organizations, state and federal entities, and industry. This research helped with the communication once in the city. Here is an example of a map I created for the Monterey Pilot Project. |
|
|
|
|
|
|
|
|
Methods Here are some of the many methods used in the acquisition and analysis
of data. IDENTIFICATION OF KEY PLAYERS IN THE SOUTH LAKE TAHOE AREA Most of the key players we found via the internet and word of mouth;
these will be the folks who determine whether or not the CRC is successful in
its efforts. “BOOTS ON THE GROUND” ANALYSIS Division staff surveyed recyclers at the local recycling center to get ideas as to what they felt about recycling in their city. The survey answers have been placed in an Access form I created for analysis. RAW DATA ANALYSIS A recycling center operator and/or a transfer station has a unique id they use when transferring recyclables to a processing plant. The processing plant tracks who and what city along with the total of containers by material type; these numbers get turned over to the Division of Recycling every month. The Division inputs the information into an Access db. We linked the Access db to Excel db and created a macro to perform a monthly calculation of containers recycled per capita and compare these numbers to previous years. GIS ANALYSIS Selecting the data was fairly easy since our Department has a wide variety of GIS data purchased from outside sources as well as inside data acquired through digitizing, GPS and db entry. To begin with, I opened ArcMap and added the following layers… · Area Boundaries: City, County, States, Parks, Water, Public Lands, Block Groups, Airport · Streets: Hwy, Main, Residential · Recycling Centers and Supermarkets - GPS’d using Trimble Goex3 o Gps’d and corrected using Pathfinder Office, exported into shapefile and projected using ArcCatalano, imported to Geodatabase and ran tools created in ArcObjects to place GPS position . · Dealer: Digitized using Yahoo maps as reference · Convenience Zones ( 1/2 mile radius around each GPSd supermarket ) o Tool in Arc Objects created to create buffers around each GPS’d supermarket · Imagery: Aerial photographs (used Geotiff and MrSID files) o Used to check placement against existing data and distance from Recycling center to shopping centers.
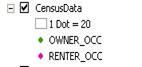
· 2000 Census Block Group Data was downloaded from US Census Bureau o This data was used to analyze the population of occupancy for Homes and Renters § First, I download the data in Excel and then converted to Access and placed in a Geodatabase where I linked the Block Group Census data with my already existing Block Group boundary file.
· Other Businesses: Digitized using Yahoo Maps as quide § Dealers: Smaller stores lik 7-11, etc. § Gyms: Curves, Push, Etc. § Media: Mountain News, KRLT radio, etc § Locations of local government § Environmental agencies |
|
|
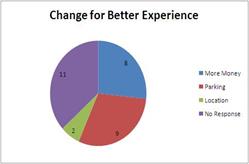
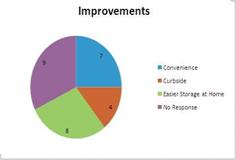
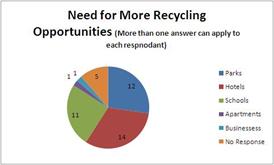
Results IDENTIFICATION OF KEY PLAYERS IN THE SOUTH LAKE TAHOE AREA South Tahoe Refuse ; The Transfer Station, “Dirty MRF” recovery facility, owner of Recycling Center as well. They are willing to incorporate routes wherever needed. Chamber of Commerce: Has a Green Task Force Team who promote recycling in businesses Clean Tahoe : Contracted by the city to pick up random trash from around the city as well as recyclables from bus stops. City of South Lake Tahoe The assistant city manager will be the main contact for coordinating recycling efforts within the city. Parks and Recreation Has a grant writer who will be writing grant proposal for all of the key players to implement new Recycling bins throughout the city. Lake Tahoe Unified School District: Superintendent of the school district will help implement recycling or no waste lunch programs in schools. The above six players have formed a committee called “Recycle Tahoe”. They claim CRC is responsible for their coming together to work with each other. CA Tahoe Conservancy: Is another key player that we have yet to meet. The Conservancy has acted as sole funder for the 56-Acre project in South Lake Tahoe. The project is in response to the Governors Green City initiative, it encompasses 56 acres of South Lake Tahoe for recreation. “BOOTS ON THE GROUND” ANALYSIS The Results from the survey conducted at the SLT recycling center were entered into Access. Word was used to create pie charts below and paint was used to save the images into .jpg format. This format was used because timing didn’t allow me to find an alternative to learn.
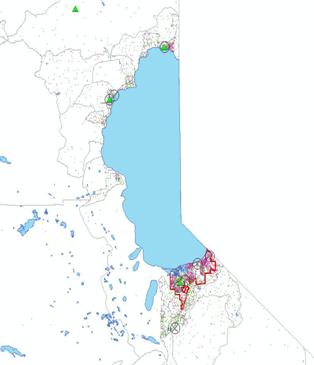
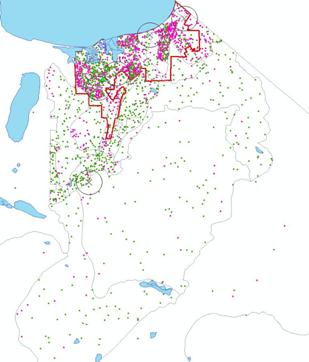
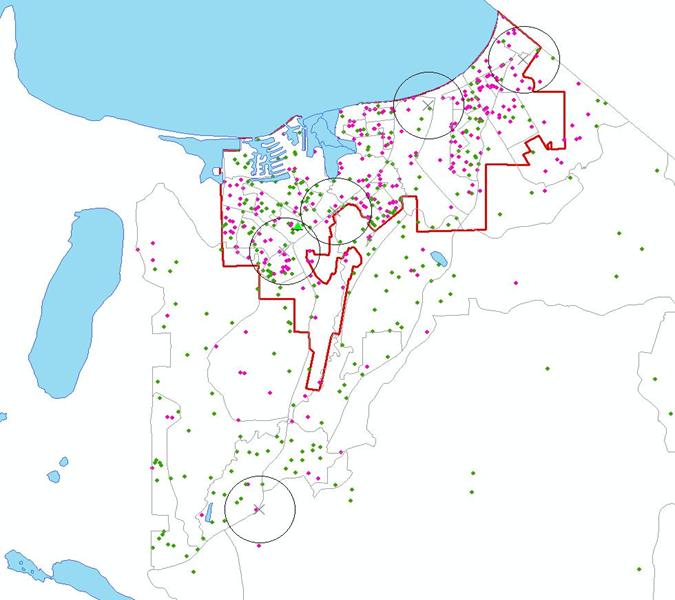
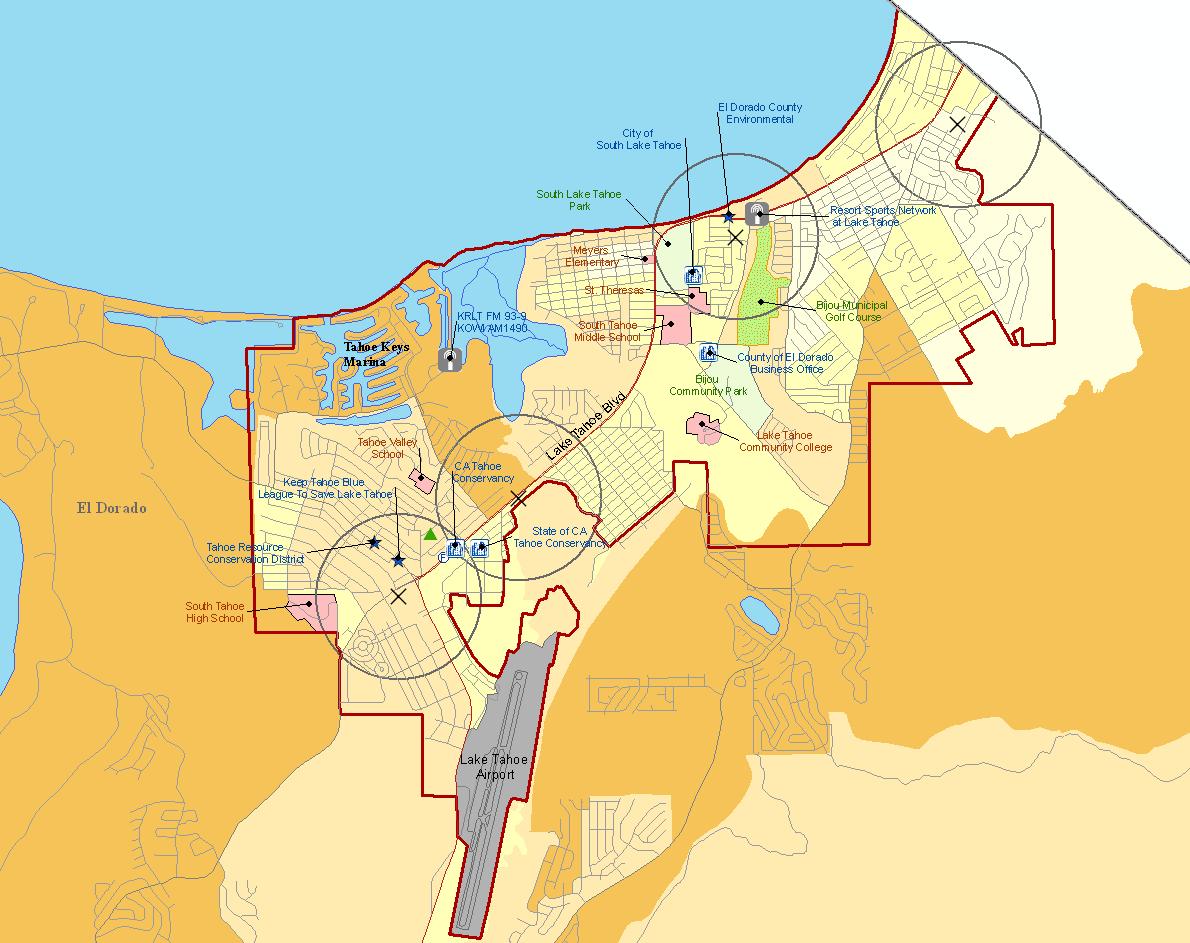
In speaking to people who are part of the community, they feel a drop-off in a store parking lot would offer more convenience. Their argument is, "People need to shop -- even in the winter". Distance and time didn't seem to be a key factor to those surveyed; however, it is important to note that those surveyed were the ones Recycling. To continue this study, we may move forward in getting approval to survey occupied homeowners in and around the city of South Lake Tahoe RAW DATA ANALYSIS The baseline was formulated in Excel which gave us a per capital total number of containers recycled of 732. The goal is to increase this number to 840 by 1/1/2009. GIS ANALYSIS The GIS analysis provides information on the locations of schools,
parks, golf courses, and other locations were recyclables can be captured. The CZ’s and RC locations provide a sense of what opportunities are
currently available for recycling. The shaded land areas are symbolized using Graduate Colors to represent
Owner occupied housing per block group. Figures and Maps
|
|
|
|
|
|
|
|
|
|
|
|
Analysis This project is for a data acquisition Geography course final project;
however, the information in this project is accurate to the best of my
ability due to the limited amount of lab time available to work on it. In
showing my supervisors this project and justifying my working on this is
related to what I’m actually doing, they have expressed an interest in
continuing the project and ‘cleaning it up’ for larger use and presentations.
The result – more work and more pressure. This is a type of phase I analysis. Again, the challenges involved were
time and experience. Before this project, I’ve had little to no experience
with HTML so I messed up my project several times before I figured out save,
save, save. There were also some difficulties in acquiring the data I needed from
the Census Bureau and joining it with my existing census data. I’m not really quite sure how I finally
acquired it – trial and error. My aerial photos posed some challenges as well. I could only find one
MrSID so I had to bring in GeoTiffs to fill in the rest. There were a total
of 4 aerial images used. Weather, tourism, lack of curbside, lack of awareness, contamination or materials, and seasonal occupant’s effect recycling rates. |
|
|
Conclusions This study highlights the
importance of spatial analysis and the “Boots on the ground” technique to
identify optimum site locations to implement recycling programs. To increase recycling in SLT, there should convenient locations and programs in place to capture these resources.. The locations identified are supermarkets, parking lots, schools, businesses, and recreation areas. Weather, tourism, lack of curbside, contamination and seasonal occupant’s effect recycling rates. |
|
|
References |
|
|
|
|
|
links |
|